Predict Diabetes using Machine Learning
So as you have read our title. Today we will be discussing about predicting diabetes using Machine Learning. For this topic we will be using Logistic Regression.
Why Logistic Regression?
Logistic Regression is a Classification model which
will help us to determine if the person has the diabetes or not. The working of
the Logistic Regression is to predict the outcome which could have answer in
the YES/NO, TRUE/FALSE, 0/1 format.
How we will predict diabetes using Logistic Regression ?
First of all we will take certain independent variable’s
i.e factors which will help us to decide that a person have diabetes or not.
Then we will train majority of the data & test them on the data which are
not trained.
To know more about Logistic Regression do check out
this blog first :
NOTE :
Meaning of all the Attributes which are present in our Dataset.
- pregnant: Number of times the women got pregnant
- glucose: Plasma glucose concentration over 2 hours in an oral glucose tolerance test
- bp (BloodPressure): Diastolic blood pressure (mm Hg)
- skin (SkinThickness): Triceps skin fold thickness (mm)
- insulin_level: 2-Hour serum insulin (mu U/ml)
- bmi (Body Mass Index): Body mass index (weight in kg/(height in m)2)
- pedgiree (DiabetesPedigreeFunction): Diabetes pedigree function (a function which scores likelihood of diabetes based on family history)
- age: Age (years)
- diabetes_label (Outcome): Class variable (0 if non-diabetic, 1 if diabetic)
So our today Agenda would be :
1.) Import Libraries & Dataset
At this step we will import all the important libraries which will help us to modify our data according to the need. Which means all the other step's which are written below will only be executed when the libraries to do that task will be imported.
Such as ;
pandas for Data manipulation.
numpy for an efficient multi-dimensional container of generic data.
matplotlib & seaborn for data visualization.
2.) Analyzing the Data
The Data visualization libraries which we called such as matplotlib & seaborn will help us to analyze data in a graphical format.
3.) Data Wrangling
This step is very crucial because at this step we will fetch all the important data which will help us to build & train our model for testing & accuracy purpose. Pandas & numpy libraries will help us for data wrangling process. How we fetch our data will decide how accurately our model will predict answers.
4.) Test & Train Data
In this step we will be splitting our data & then we will train & test that data accordingly.
Splitting of the data will be done by train_test_split method from sklearn (Scikit-learn) for creating Training dataset & Testing dataset which will be at 80-20 ratio which means 80% will be training data & 20% will be our testing data.
Training & Test of our data will be done within few line of code by an (Scikit-learn) sklearn library which I mentioned above. After that we have to create our model for that we use Logistic Regression which will also available at sklearn. Don't worry it's hardly 4 to 5 line of code.
5.) Check Accuracy
At this step we will check... How accurate our model is? & How accurately it will perform if the data which is provided is large in numbers?
How we will check accuracy of our model?
* By inserting the values which we kept for testing purpose.
* Insert our own values & see what result our model gave.
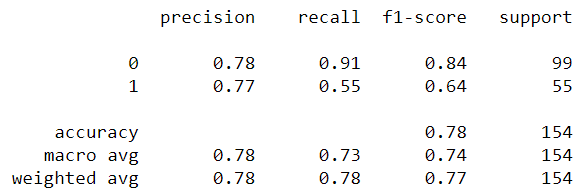
* Then we will print a classification report. (will be explained in upcoming blog)
* Then we will compare actual value vs predicted value.
* Then we will be using confusion matrix. (will be explained in upcoming blog)
* At last we will recall our score.
1.) Importing all the Libraries & Dataset
#Import all the libraries
import numpy as np
import pandas as pd
import matplotlib.pyplot as plt
import seaborn as sns
%matplotlib inline
import pandas as pd
import matplotlib.pyplot as plt
import seaborn as sns
%matplotlib inline
#Call the data
data=pd.read_csv(r"D:/Dig/pima.csv")
data.head()
data.head()
#Lets Describe our Data
data.describe()
2.) Analyzing the data
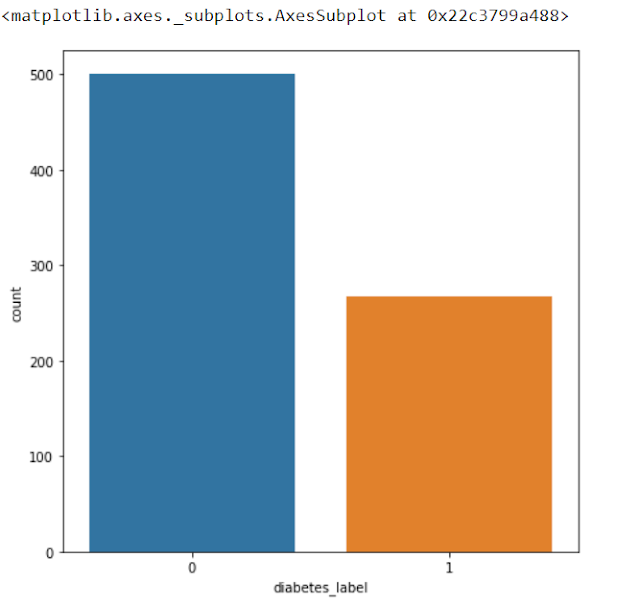
#How may people have Diabetes ( 0 = Not Diabetic & 1 = Yes )
plt.figure(figsize=(8,7))
sns.countplot(x="diabetes_label",data=data)
sns.countplot(x="diabetes_label",data=data)
3.) Data Wrangling
#Separate Independent variable's& Dependent variable
X=data[['pregnant','glucose','bp','skin','insulin_level','bmi','pedgiree','age']]
y=data['diabetes_label']
y=data['diabetes_label']
#Check if there are any null value's
data.isnull().sum()
Since there are no null value's so that's enough.
4.) Test & Train Data
#Split our data into 80-20 ration i.e (80% to Train & 20% to test)
from sklearn.model_selection import train_test_split
X_train,X_test,y_train,y_test=train_test_split(X,y,test_size=0.2)
print(X_test.shape," ",X_train.shape)
X_train,X_test,y_train,y_test=train_test_split(X,y,test_size=0.2)
print(X_test.shape," ",X_train.shape)
output :
(154, 8) (614, 8)
#Calling Logistic Regression
from sklearn.linear_model import LogisticRegression
model=LogisticRegression()
model.fit(X_train,y_train)
model=LogisticRegression()
model.fit(X_train,y_train)
output :
LogisticRegression(C=1.0, class_weight=None, dual=False, fit_intercept=True,
intercept_scaling=1, l1_ratio=None, max_iter=100,
multi_class='warn', n_jobs=None, penalty='l2',
random_state=None, solver='warn', tol=0.0001, verbose=0,
warm_start=False)
5.) Check Accuracy
#Check the accuracy of model
model.score(X_test,y_test)
output :
0.7792207792207793
#Let's check our model's prediction's
model.predict([[6,148,72,35,0,33.6,0.627,50]])
output :
array([1], dtype=int64)
#Let's print classification report
pred=model.predict(X_test)
from sklearn.metrics import classification_report
print(classification_report(y_test,pred))
from sklearn.metrics import classification_report
print(classification_report(y_test,pred))
#Now we will use metrics for in depth analysis
y_test.value_counts()
#Mean
y_test.mean()
output :
0.33116883116883117
#Actual v/s Predicted
print("Actual diabetes lables : ",y_test.values[0:15])
print("Predicted diabetes lables : ",pred[0:15])
print("Predicted diabetes lables : ",pred[0:15])
output :
Actual diabetes lables : [0 1 1 0 1 0 0 0 0 1 0 1 0 1 0]
Predicted diabetes lables : [0 0 0 0 1 0 0 0 0 0 0 0 0 1 0]
#Confusion Matrix
print(metrics.confusion_matrix(y_test,pred))
output :
[[95 8]
[26 25]]
#Recalling Score
print(metrics.recall_score(y_test,pred))
output :
0.49019607843137253
So guy's this is how we create a model for detecting diabetes.
Thank you guys!...If you guy's like it share it with our friend & if you have any suggestions drop a comment in below.


Which open source software using for diabetes prediction?
ReplyDeleteAnaconda Jupyter Notebook
DeleteWhich open source software is used here for diabetes prediction?
ReplyDeleteAnaconda Jupyter Notebook
Delete