How To Find Optimal Threshold Value And Change Threshold Value In Logistic Regression
If someone who doesn’t know what is a Threshold value in Logistic
Regression then you must check out this link
https://www.infinitycodex.in/logistic-regression-in-machine-learning
And for those who know what threshold value is can keep on reading.
Now why some users/client want to change there
threshold value & at which problem we should decide that we have to change
the threshold value.
Now the threshold value can be increased or decreased
based on the problem or dataset we are dealing with. By the way, the default
threshold value in Logistic Regression is 0.5. Now you must be thinking why
the hell we want to increase or decrease the threshold value?
Let’s understand this with 2 simple scenarios one for
decreasing and others for increasing the threshold value.
1.) Decreasing the Threshold value:
Let’s say you want to predict that the students who score
less than 30% failed in there examination. So at this problem statement, you have
to reduce the threshold value at 30%.
2.) Increasing the Threshold value:
Let’s say you got a cancer dataset and doctor’s told you that you have to predict the person is having cancer or not. If the person is above 80% infected than that person should be considered as worst infected by cancer and need immediate chemotherapy if that person is having less than 80% the chance that we can consider that person can be treated with normal medication.
I know most of them to know all this thing already by the main question is how do we code this entire process from finding optimal Threshold value till the changing the threshold value.
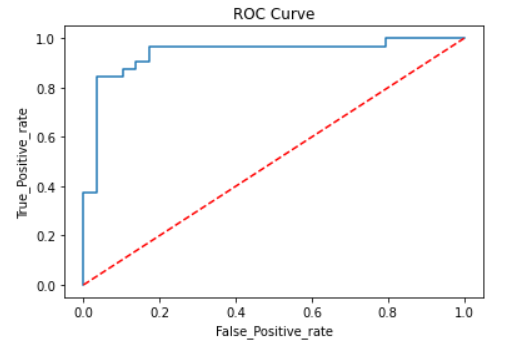
We will be using the ROC Curve which will help us to predict the optimal threshold value. For those who don't know what the ROC Curve is... ROC Curve is known as Receiver Operating Characteristic.
* ROC Curve is used in Binary Classification.
* It is a plot of True Positive Rate(1) on Y-Axis against False Positive Rate(0) on X-Axis.
* Once you get the output in probability. You can use the different cut-off to distinguish what is going to be the True Case and what will be the False Case.
* ROC Curve say when your curve is closer to the Y-Axis that is True Positive Rate than it is a very good model and your model is in between that is 0.5 than it's an average model and if your curve is towards the False Positive Rate than it's the worst model.
ROC Curve looks something like this:
CODE:
import numpy as np
data = pd.read_csv("D:\corona\heart_Disease\heart.csv")
data.head()
 |
data.head()
X = data.drop('target', axis=1).values
y = data['target'].values
X_train, X_test, y_train, y_test = train_test_split(X, y, test_size=0.2, random_state=42)
Normalizing the values using MinMaxScaler.
scaler = MinMaxScaler()
X_train = scaler.fit_transform(X_train)
X_test = scaler.transform(X_test)
Find Threshold Value
Here you can use Decision Tree, Random Forest, Bagging, Boosting.. etc.
# Random Forest
from sklearn.ensemble import RandomForestClassifier
rf_model = RandomForestClassifier()
rf_model.fit(X_train, y_train)
rf_ytrain_pred = rf_model.predict_proba(X_train)
print("RF Train roc-auc:{}".format(roc_auc_score(y_train, rf_ytrain_pred[:,1])))
rf_y_test_pred = rf_model.predict_proba(X_test)
print("RF Test roc-acc:{}".format(roc_auc_score(y_test, rf_y_test_pred[:,1])))
#----------------------------------------------------------------------------------
# Logistic Regression
from sklearn.linear_model import LogisticRegression
lg_model = LogisticRegression()
lg_model.fit(X_train, y_train)
lg_ytrain_pred = lg_model.predict_proba(X_train)
print("LG Train roc-auc:{}".format(roc_auc_score(y_train, lg_ytrain_pred[:,1])))
lg_y_test_pred = lg_model.predict_proba(X_test)
print("LG Test roc-auc:{}".format(roc_auc_score(y_test, lg_y_test_pred[:,1])))
Output:
RF Train roc-auc:1.0
RF Test roc-acc:0.915948275862069
LG Train roc-auc:0.9226736566186108
LG Test roc-auc:0.9450431034482759
Selection Of Best Threshold Value For Accuracy
for model in [rf_model, lg_model]:
pred.append(pd.Series(model.predict_proba(X_test)[:,1]))
final_pred = pd.concat(pred, axis=1).mean(axis=1)
print("Ensemble test roc-auc:{}".format(roc_auc_score(y_test,final_pred)))
Output:
Ensemble test roc-auc:0.9407327586206897
False_pos_rate, True_pos_rate, threshold = roc_curve(y_test, final_pred)
threshold
Output:
array([1.97525308, 0.97525308, 0.82803343, 0.82740393, 0.61206134, 0.5829135 , 0.48185878, 0.45554149, 0.45229139, 0.38156861, 0.21880427, 0.07000419, 0.06909258, 0.0069847 ])
These are some of the best candidates from which we can select our threshold value.
acc = []
for thres in threshold:
y_pred = np.where(final_pred>thres,1,0)
#what ever prediction i am getting and if it is greater than threshold i'll be converting as 1 or i'll keep it as 0.
acc.append(accuracy_score(y_test,y_pred,normalize=True))
#Then i'll be computing my accuracy score with my y_test and then
#append the accuracy inside acc list.
acc = pd.concat([pd.Series(threshold), pd.Series(acc)], axis=1)
acc.columns = ['threshold','accuracy']
acc.sort_values(by="accuracy", ascending=False, inplace = True)
acc.head()
These are top 5 threshold values.
def plot_roc_curve(False_pos_rate,True_pos_rate):
plt.plot(False_pos_rate, True_pos_rate, label="ROC")
plt.plot([0,1],[0,1],color="Red",linestyle="--")
plt.xlabel("False_Positive_rate")
plt.ylabel("True_Positive_rate")
plt.title("ROC Curve")
plt.legend
plt.show()
plot_roc_curve(False_pos_rate,True_pos_rate)
These are some of the best candidates from which we can select our threshold value.
Create A Model with 0.61 Threshold
from sklearn.metrics import accuracy_score, confusion_matrix, recall_score, roc_auc_score, precision_score, classification_report
clf = LogisticRegression(class_weight="balanced")
clf.fit(X_train, y_train)
THRESHOLD = 0.61
preds = np.where(clf.predict_proba(X_test)[:,1] > THRESHOLD, 1, 0)
pd.DataFrame(data=[accuracy_score(y_test, preds), recall_score(y_test, preds), precision_score(y_test, preds), roc_auc_score(y_test, preds)], index=["accuracy", "recall", "precision", "roc_auc_score"])
[[28 1]
[ 9 23]]
Follow us at :
Instagram :
https://www.instagram.com/infinitycode_x/
Facebook :
https://www.facebook.com/InfinitycodeX/
Twitter :
https://twitter.com/InfinityCodeX1


Thanks for the information, I rarely find what I’m looking for… finally an exception! Gudang di Medan
ReplyDelete